Business intelligence & data analytics

Turn your data into decisions.

BZME Insights builds dashboards, reporting systems and data tools that show SACCOs, NGOs, retailers and growing businesses where money, stock, customers and results are slipping, and what to do about it.

Example monthly management reporting dashboard built by BZME Insights
Example: Monthly Management Reporting Pack (sample data)
11portfolio projects, each ending in a recommendation
9sectors covered, from SACCOs and NGOs to retail and telecom
Anycurrency: reporting in KES, USD or whichever you work in
Remoteworking with clients wherever they are, from a base in Kenya (UTC+3)

What we do

Reporting your team can trust and use

From a first KPI dashboard to a full reporting pipeline, we build the tools that replace guesswork with evidence.

Analytics & BI

Dashboards, reporting systems and analysis that turn your data into answers.

Explore

Sector solutions

Ready-to-adapt reporting for SACCOs, NGOs, marketing teams and operations.

Explore

Automation & data collection

Cut manual reporting and collect clean field data.

Explore

Design, training & web

Make reports clear, upskill your team and get online.

Explore

Who we help

Built for organisations like yours

SACCOs & microfinance

Loan-book risk, PAR and provisioning packs your board can act on.

NGOs & programmes

M&E dashboards and donor-ready reports that show progress and spend together.

Retail & e-commerce

Sales, stock and campaign ROI reporting that shows what to reorder, push or pause.

Corporates & distributors

Monthly management packs and reporting pipelines across your systems.

Selected work

Every project starts with a business question

Explore four of our eleven portfolio projects. Each has a working Excel model, a dashboard and a write-up.

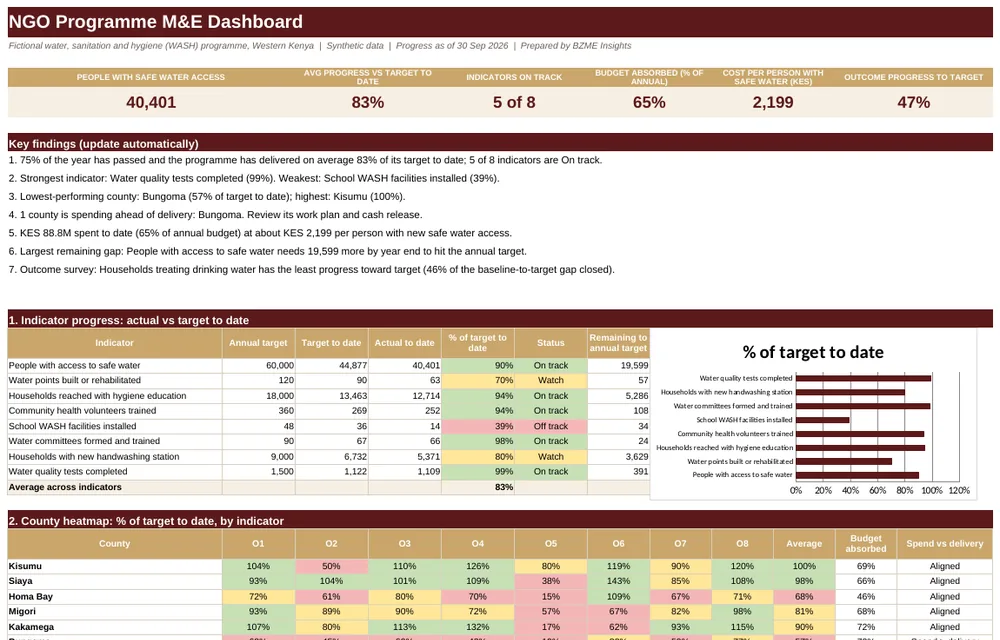
Dashboard screenshot: Monthly Management Reporting Pack
Finance / managementSample data

Monthly Management Reporting Pack

How did the month perform against budget, and which variances matter?

Revenue on budget, yet operating profit 52% below budget

ExcelVariance analysis
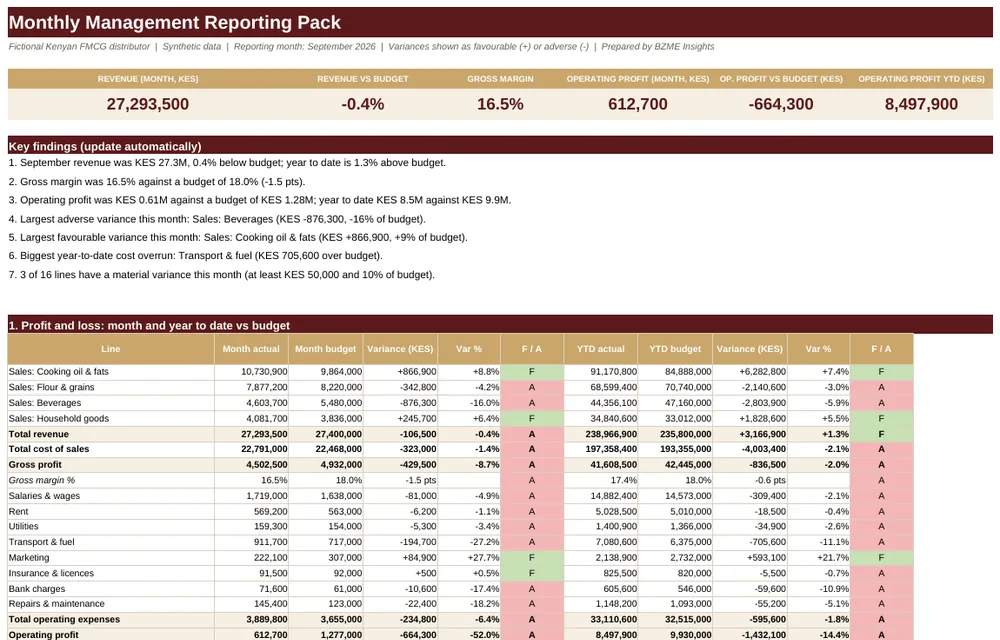
Dashboard screenshot: NGO Programme M&E Dashboard
NGO / developmentSample data

NGO Programme M&E Dashboard

Is a programme on track against its annual targets, and does spending match delivery?

83% of target to date, with 5 of 8 indicators on track
ExcelM&EDonor reporting
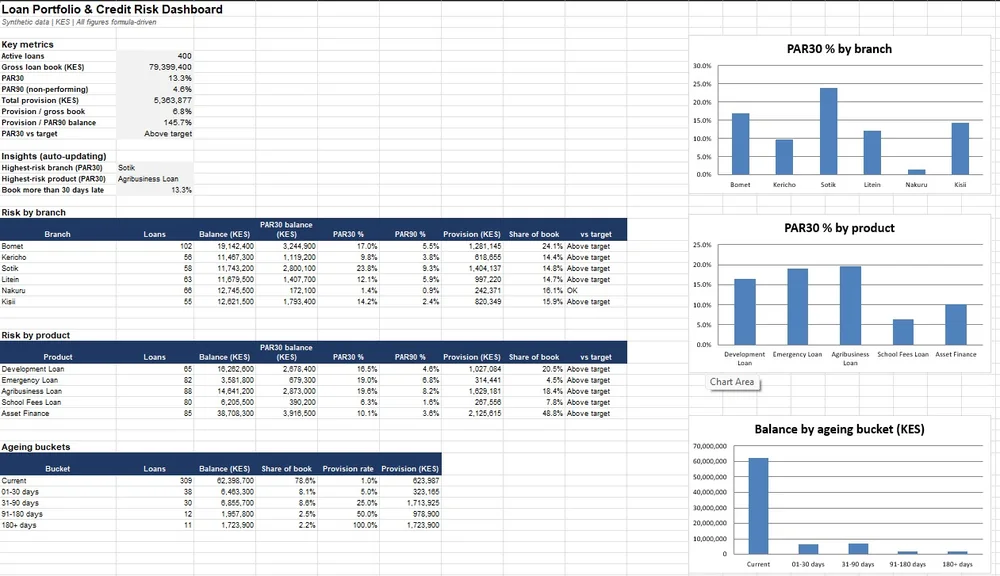
Dashboard screenshot: Loan Portfolio & Credit Risk
SACCO financeSample data

Loan Portfolio & Credit Risk

How healthy is a SACCO loan book, where is the risk, and are provisions adequate?

PAR30 of 13.3% against a 5% target
ExcelPARProvisioning
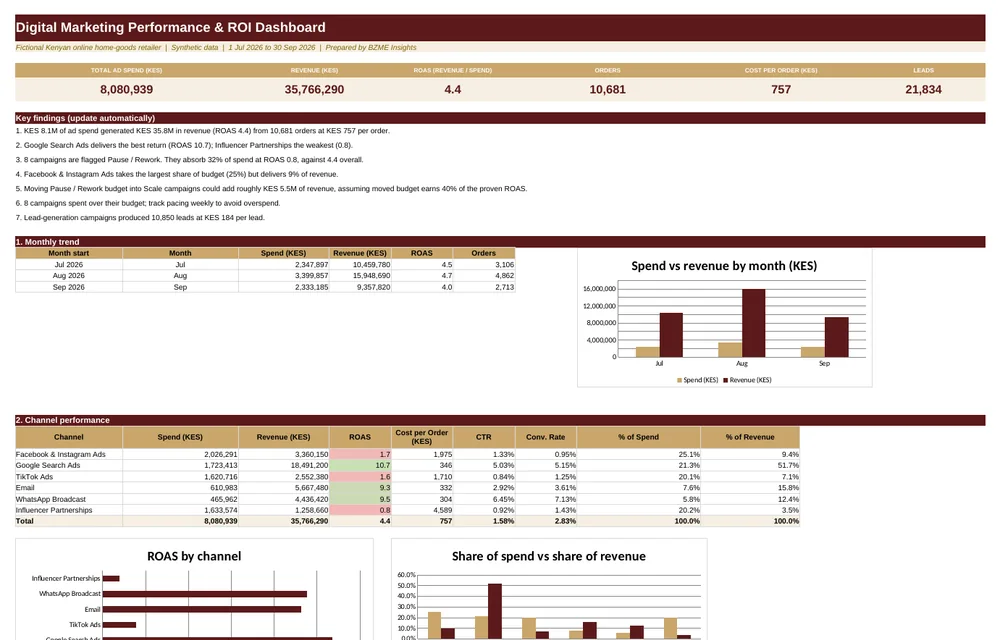
Dashboard screenshot: Digital Marketing Performance & ROI
E-commerce marketingSample data

Digital Marketing Performance & ROI

Which campaigns deserve more budget, and which should be paused?

8 campaigns absorb 32% of spend at a 0.8 return

ExcelROASScenarios

View all 11 projects

How we work

Simple, transparent and in milestones

1

Discovery call

A short call to confirm your questions, data sources and timeline.

2

Clear written quote

Scope, deliverables, revisions included and a payment schedule, agreed before work starts.

3

Build in milestones

Draft, feedback and final delivery, with a walkthrough and handover so your team can use it.

Why BZME Insights

Analysis you can check, not a black box

We build with tools your team already knows, and we show our working.

  • Question first. Every project starts with a decision you need to make and ends with a recommendation.
  • Assumptions you can change. Thresholds, targets and rates sit on one sheet, so the numbers update when your situation does.
  • Built around your context. Your currency, your industry's terms and the tools you already use, from SACCO loan books to NGO programmes, retail and beyond.
  • Handover included. We explain the model and leave you with documentation, so you are never locked in.

Ready to see what your data is telling you?

Tell us about your reporting challenge. We will reply with a clear scope, timeline and quote.

WhatsApp us