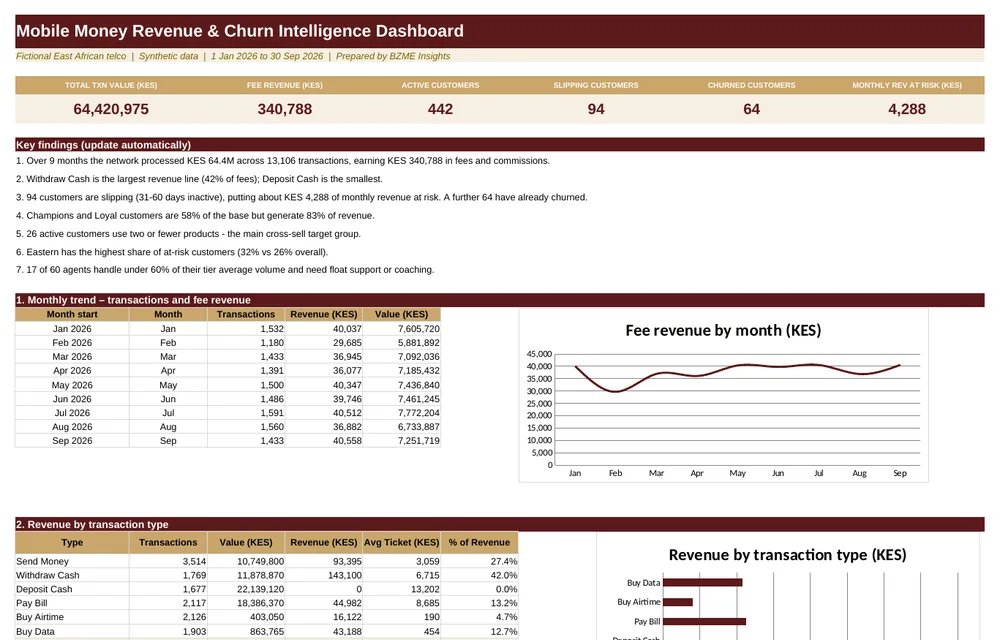
Mobile Money Revenue & Churn
Which customers drive fee revenue, and which valuable ones are slipping away?
58% of customers generate 83% of fee revenue

Portfolio
Every project has a working Excel model, a dashboard and a write-up explaining the method. Open any one on GitHub to download the workbook and change the assumptions yourself.
Which customers drive fee revenue, and which valuable ones are slipping away?
58% of customers generate 83% of fee revenue
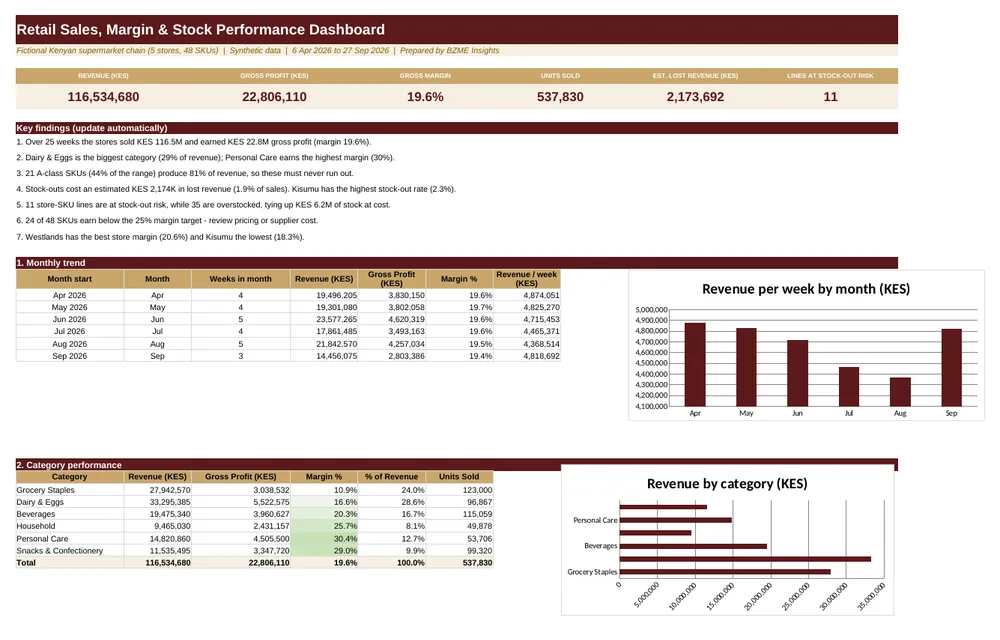
Which products drive revenue, where is stock running out, and where is cash tied up?
21 SKUs generate 81% of revenue
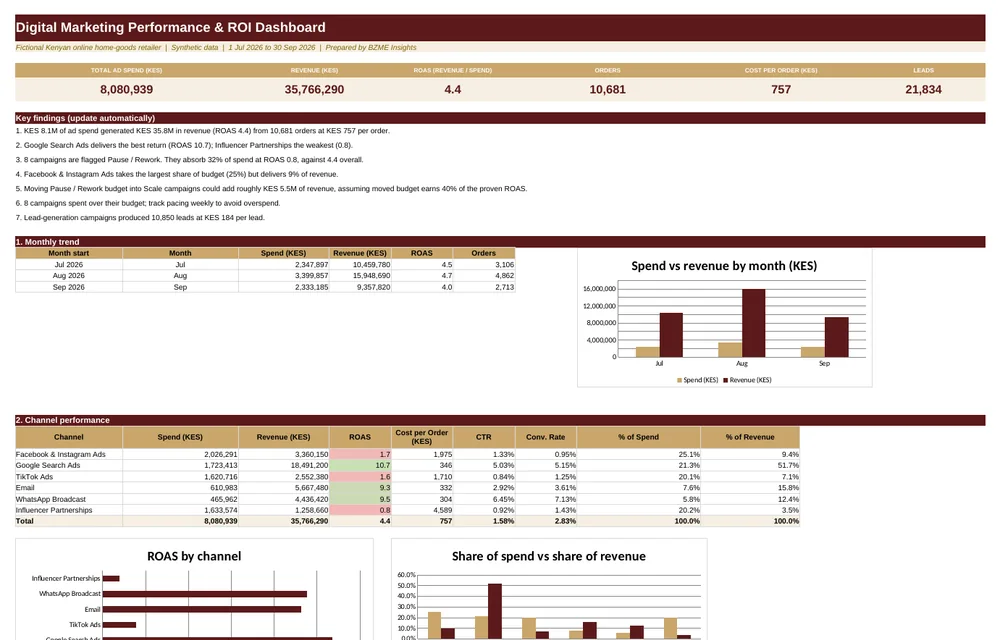
Which campaigns deserve more budget, and which should be paused?
8 campaigns absorb 32% of spend at a 0.8 return
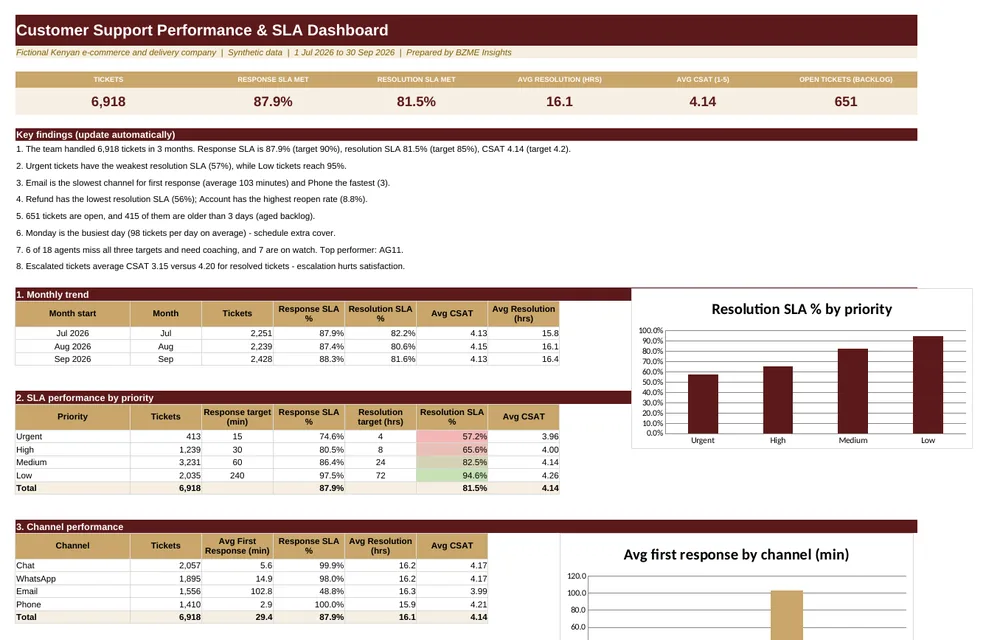
Is the support team hitting its SLA targets, and where is it failing?
81.5% resolution SLA against an 85% target
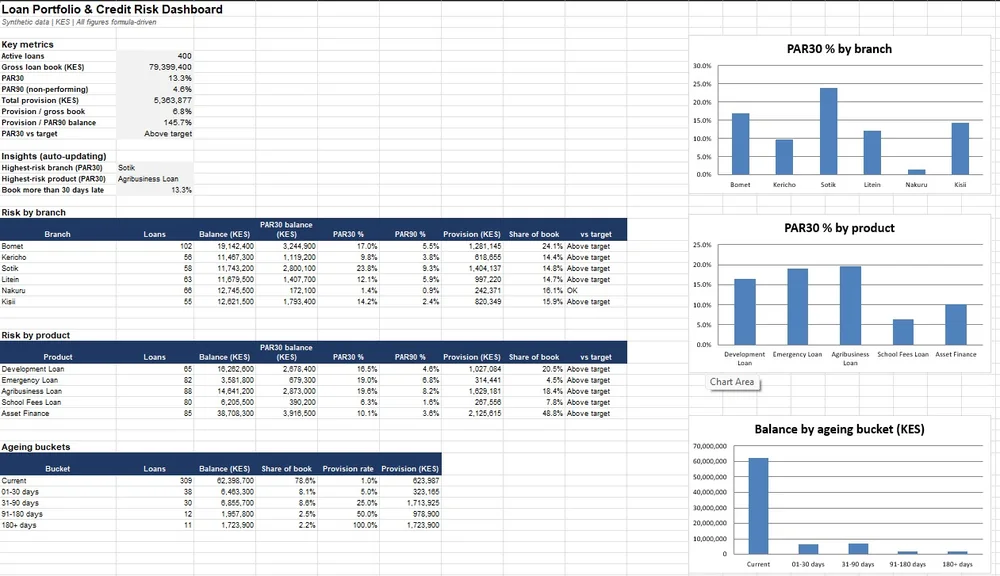
How healthy is a SACCO loan book, where is the risk, and are provisions adequate?
PAR30 of 13.3% against a 5% target
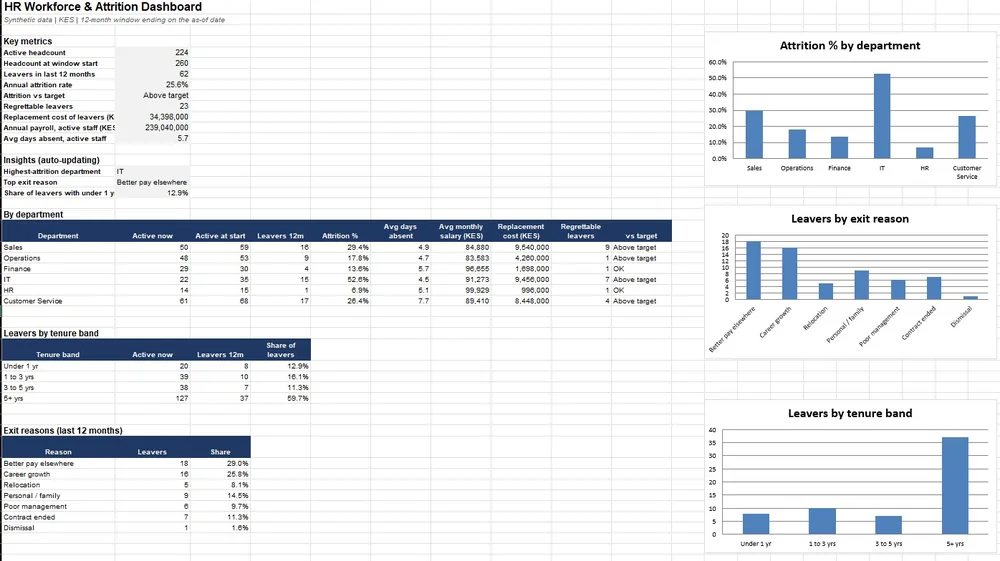
How fast is a company losing staff, who is leaving, why, and what does it cost?
25.6% attrition against a 15% target
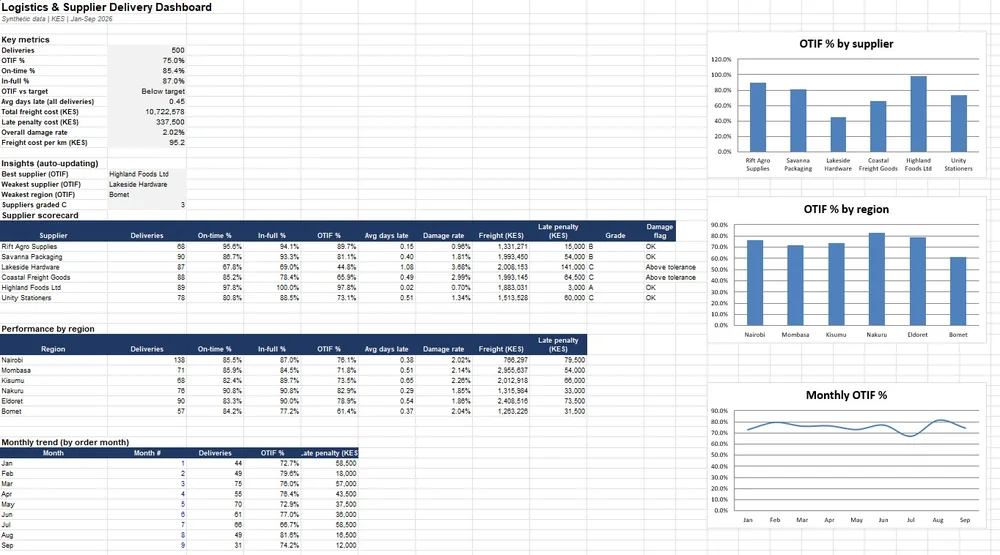
Which suppliers deliver on time and in full, and what do late deliveries cost?
75% OTIF against a 90% target
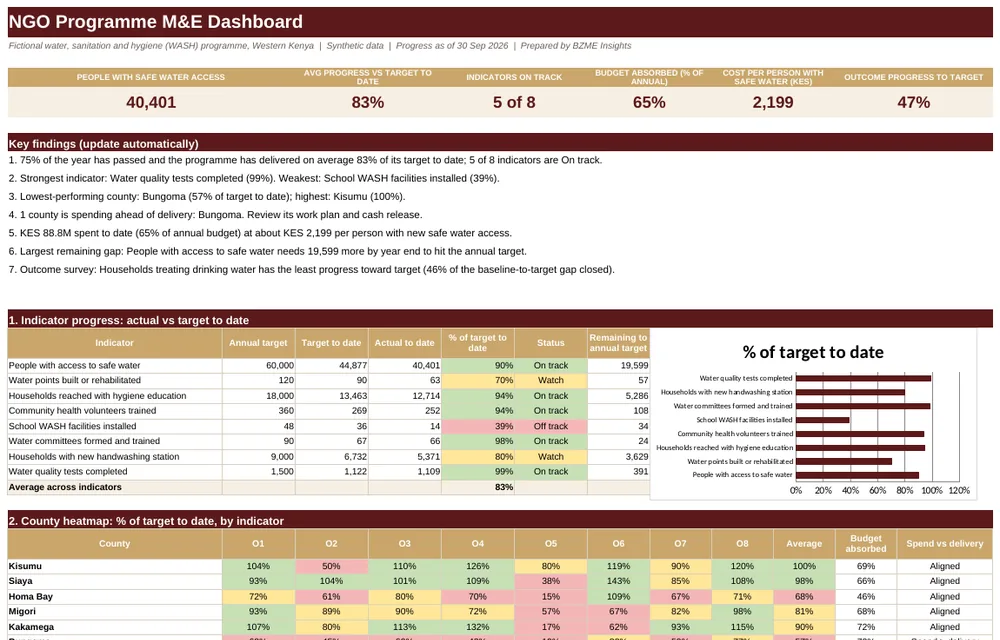
Is a programme on track against its annual targets, and does spending match delivery?
83% of target to date, with 5 of 8 indicators on track
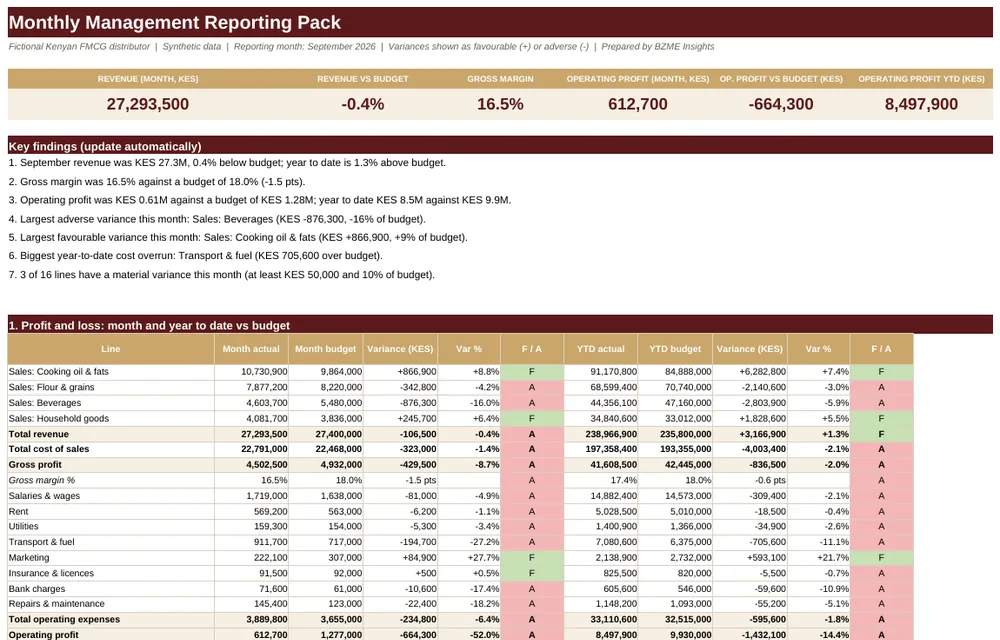
How did the month perform against budget, and which variances matter?
Revenue on budget, yet operating profit 52% below budget
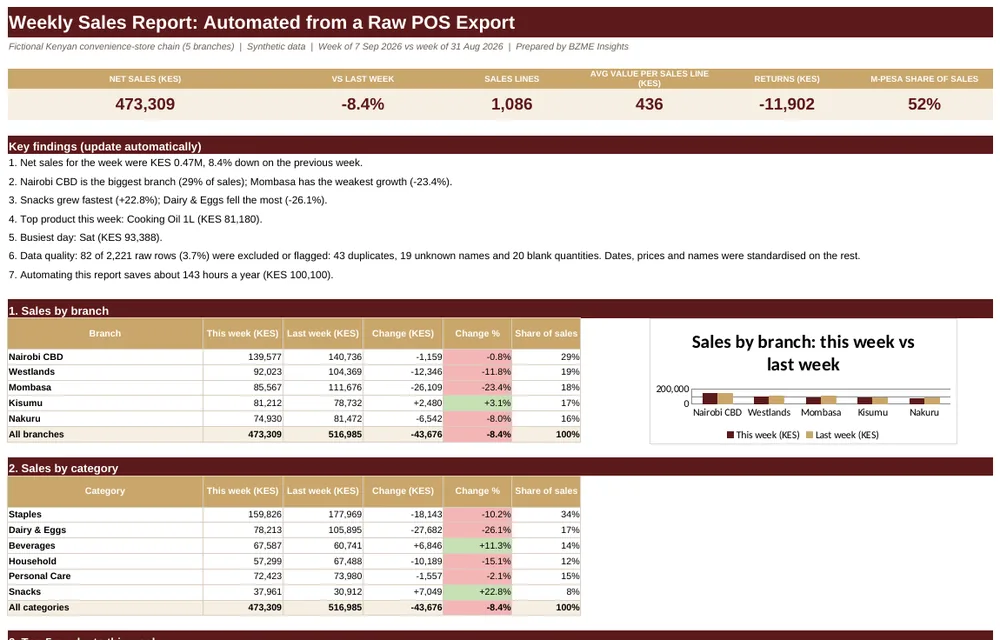
Can a weekly report refresh itself from a messy export, and show what it fixed?
2,221 messy rows cleaned, with a data-quality log
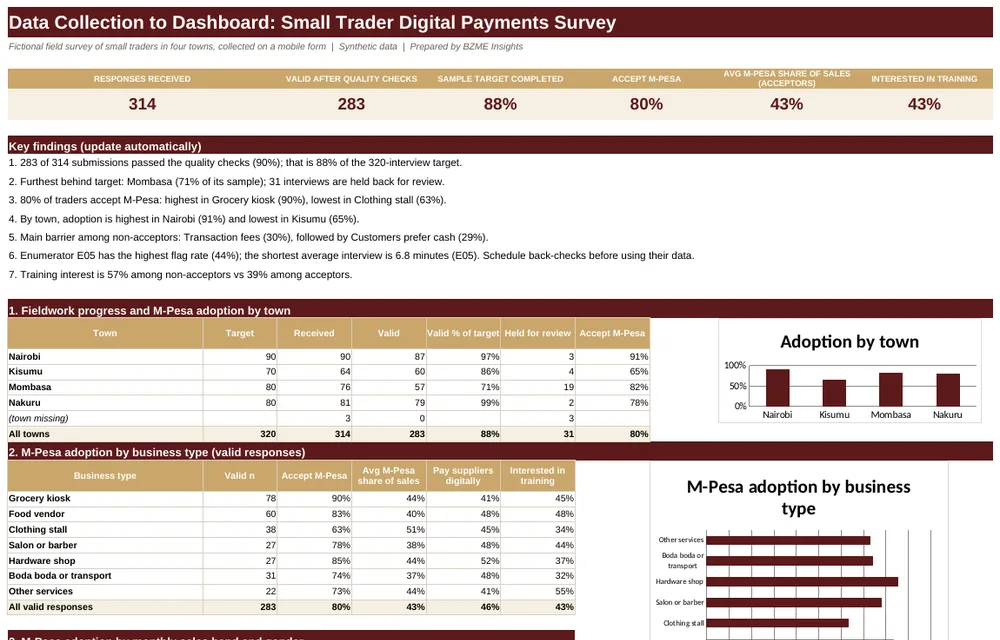
Can field survey data be collected, quality-checked and analysed quickly?
283 of 314 sample submissions passed quality checks
Tell us about your reporting challenge. We will reply with a clear scope, timeline and quote.